Splunk integration guide
Connect Splunk to the WeTransfer Activity Events API and stream workspace events into your SIEM.
What you'll need
- An Activity API token — see Generate an API token in the main Activity Log guide
- A Splunk Enterprise instance (Cloud or self-hosted), version 9.x or later
Step 1 — Install the REST API Modular Input add-on
The integration relies on the REST API Modular Input add-on by BaboonBones Ltd (Damien Dallimore), which is available on Splunkbase.
- In the Splunk web UI, open Apps → Find More Apps
- Search for REST API Modular Input and install it from Splunkbase
- Restart Splunk when prompted
Step 2 — Configure a new REST input
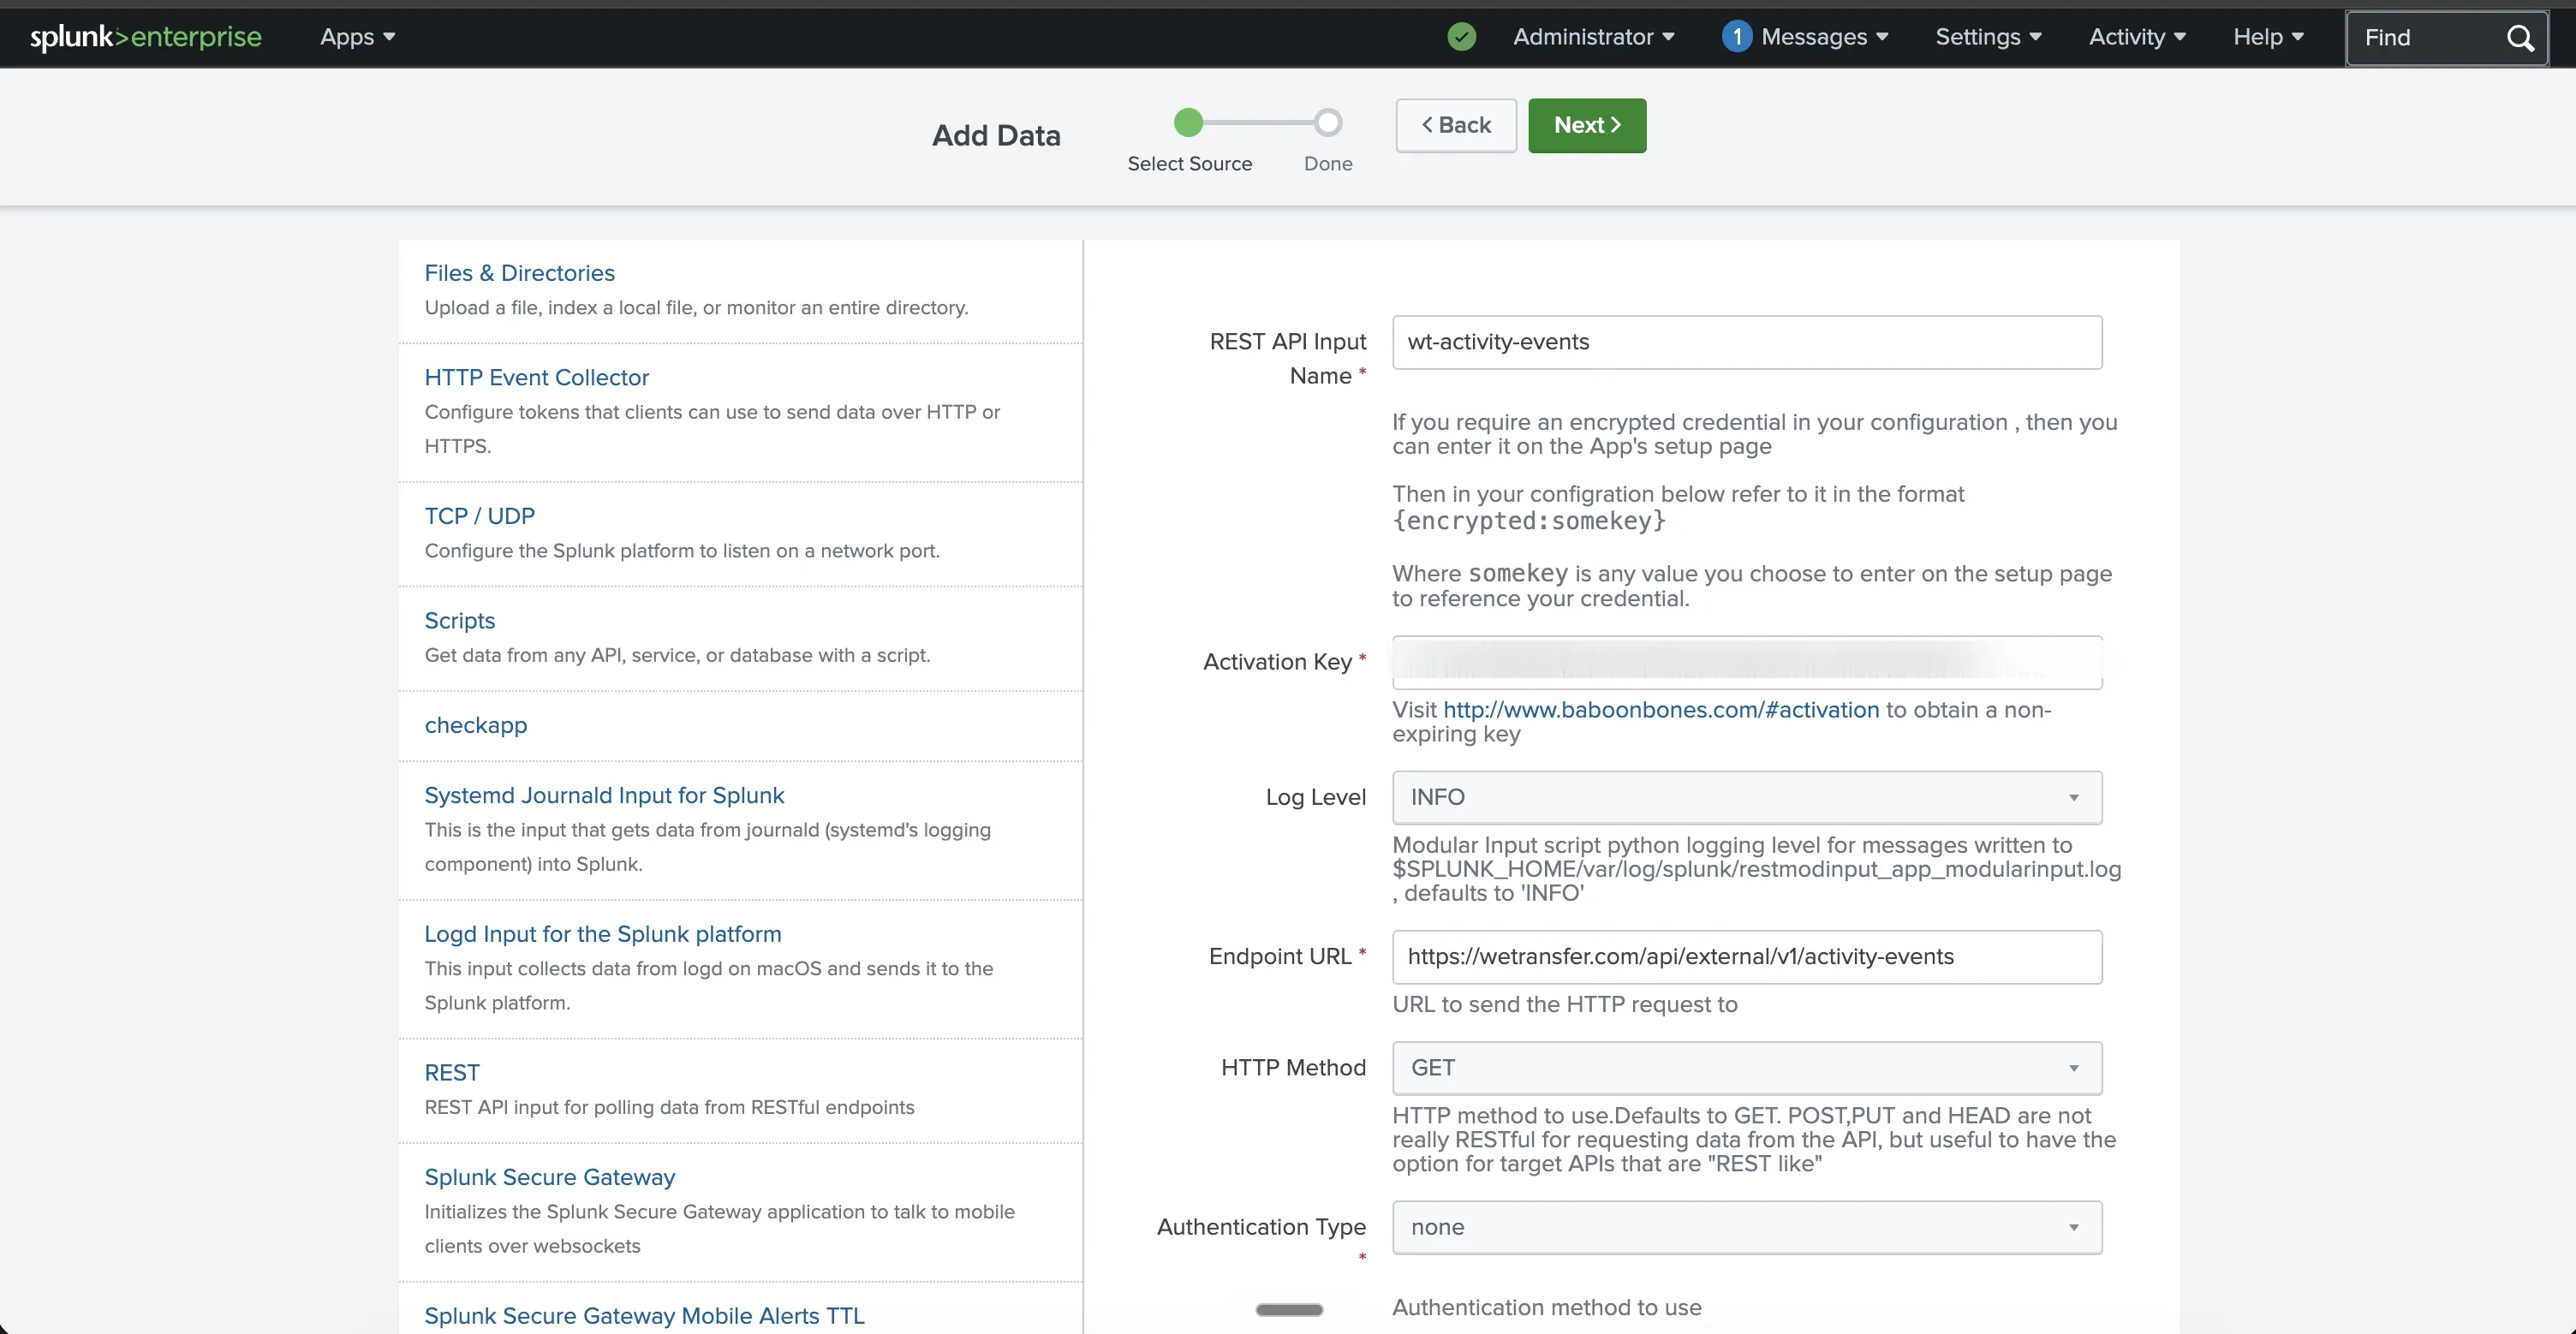
Go to Settings → Data inputs → REST → New and fill in the form with the values below. Field names match the labels shown by the add-on.
| Field | Value |
|---|---|
| Endpoint URL | https://wetransfer.com/api/external/v1/activity-events |
| HTTP Method | GET |
| Authentication type | none — the bearer token is sent via a custom header instead |
| HTTP Header Properties | Authorization=Bearer <YOUR_TOKEN> |
| URL Arguments | since=YYYY-MM-DDTHH:MM:SSZ — set this to the ISO 8601 timestamp you want to start from. Anything older than 1 year is rejected, since events are retained for 1 year only. |
| Response type | json |
| Polling Interval | 60 seconds (recommended). The API supports up to 1 request/sec, but 60s is plenty for SIEM use. |
| Response Handler | WTActivityEventHandler — we'll add this in Step 3. |
| Sourcetype | Set to Manual and enter wetransfer:activity |
| Index | Pick the index you want events written to, or leave the default |
Step 3 — Add the custom response handler
The WeTransfer endpoint returns a single JSON object containing an events[] array and a next_cursor. By default, the REST add-on indexes the whole response as one Splunk event. To get one Splunk event per WeTransfer activity event, add a small custom response handler.
Edit $SPLUNK_HOME/etc/apps/rest_ta/bin/responsehandlers.py and append:
class WTActivityEventHandler:
    """Splits the WeTransfer activity-events response (dict with events[]) into one Splunk event per WT event."""
    def __init__(self, **args):
        pass

    def __call__(self, response_object, raw_response_output, response_type, req_args, endpoint, oauth2=None):
        if response_type == "json":
            output = json.loads(raw_response_output)
            for entry in output.get("events", []):
                print_xml_stream(json.dumps(entry))
        else:
            print_xml_stream(raw_response_output)
Restart Splunk after editing the file.
Step 4 — Verify ingestion
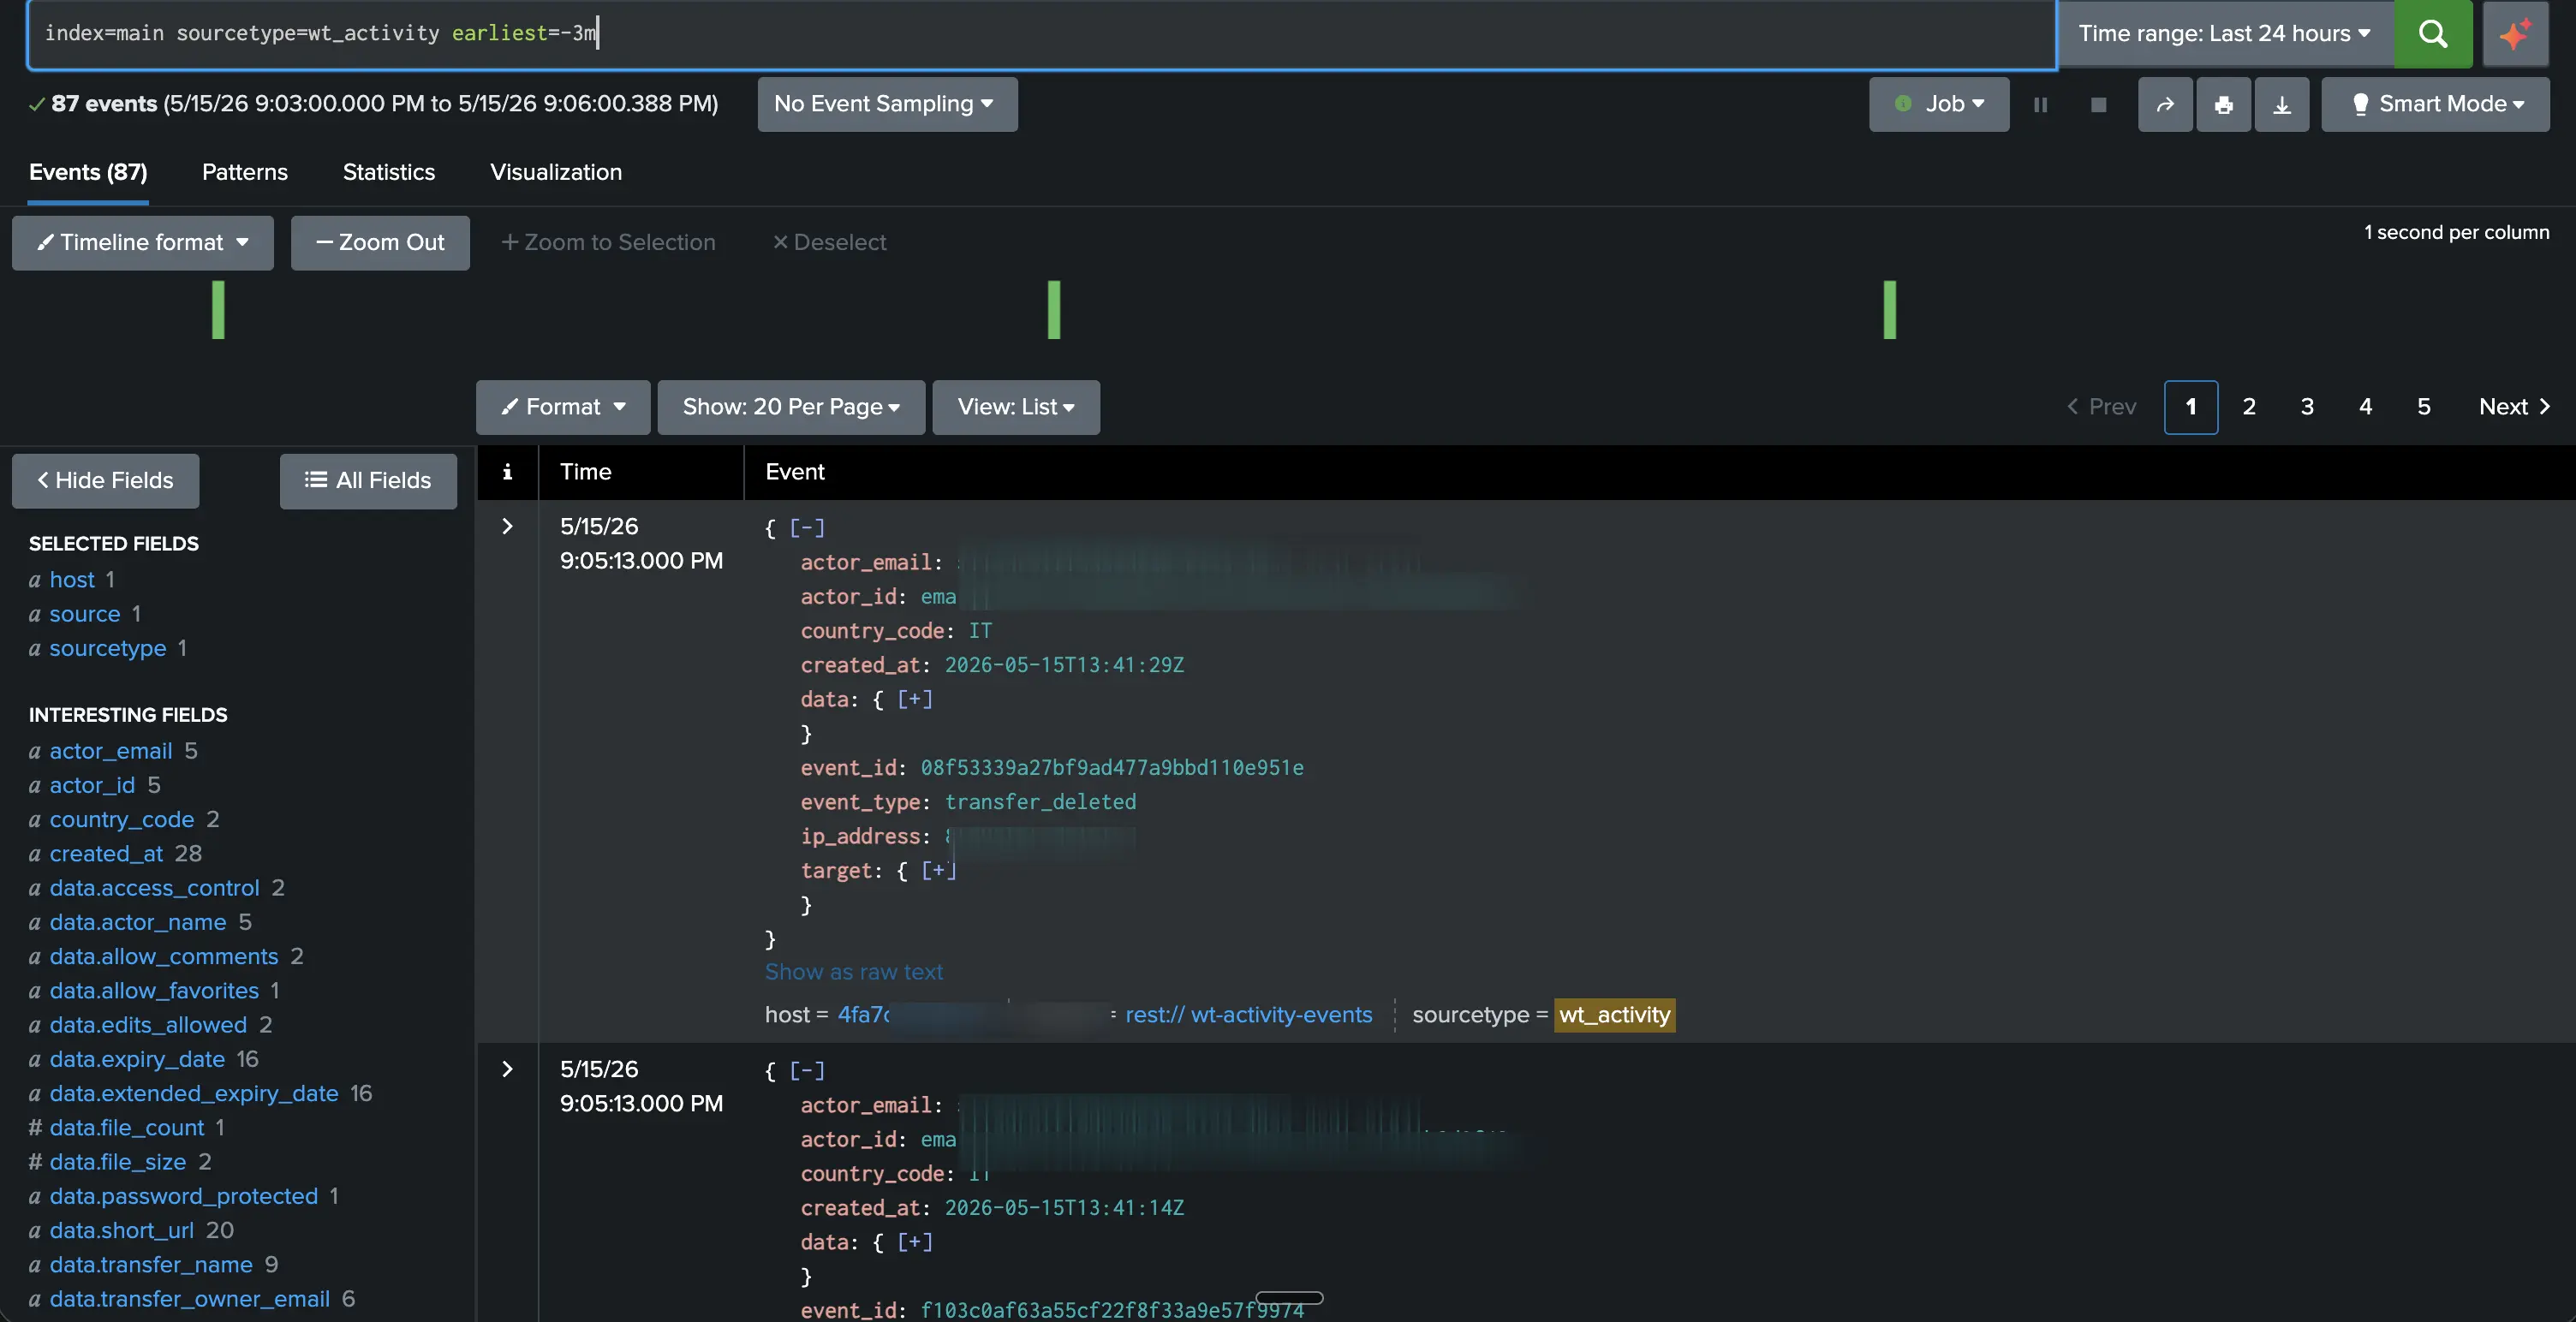
In the Splunk search bar, run:
index=<your-index> sourcetype=wetransfer:activity | head 20
You should see one Splunk event per WeTransfer activity event, with the following fields visible: event_id, event_type, actor_email, actor_id, ip_address, country_code, created_at, target.*, and data.*.
Step 5 — Pagination notes
- The REST add-on doesn't follow the
next_cursorautomatically. For backfilling large historical ranges, run a one-off script that paginates throughnext_cursoruntilhas_moreisfalse, then point the add-on at the present. - For ongoing ingestion, a 60s polling interval is enough for typical workspaces — events per minute usually fit in a single page, so cursor follow-up isn't needed. For higher-volume workspaces, see the backfill note above.
- The endpoint returns at most 100 events per response (default 50).
Building alerts on top
Once events are flowing in, you can build alerts on top of the wetransfer:activity data using Splunk's built-in saved-search and alerting features. Detection design is workspace- and policy-specific, so refer to Splunk's own documentation for the alert options available in your version.
Troubleshooting
Most Splunk-side issues with this integration show up in $SPLUNK_HOME/var/log/splunk/restmodinput*.log — check there first when something looks off.
| Symptom | What's happening / fix |
|---|---|
| Each poll is indexed as a single giant JSON blob | The custom response handler from Step 3 isn't being applied. Check that the Response Handler field in the REST input config is exactly WTActivityEventHandler, that the class was appended to responsehandlers.py, and that Splunk was restarted after the edit. |
| Events appear but no fields are extracted | Same root cause as above — the handler is responsible for splitting each WeTransfer event into a separate JSON document, which Splunk then auto-extracts. Verify the handler name and code, then restart. |
| Duplicate events on every polling cycle | The since parameter in URL Arguments is static — the add-on re-fetches the same events on every poll. Duplicates are written to the index; dedupe them at search time with | dedup event_id. To avoid them at ingestion, use the add-on's response substitution to advance the cursor each poll (advanced). |
401 errors in restmodinput*.log | The bearer token in HTTP Header Properties is missing, malformed, or revoked. Re-check the Authorization=Bearer <token> line and, if needed, generate a new token from the WeTransfer admin panel. |
Timeouts or connection refused to wetransfer.com | Network egress issue. Your Splunk host can't reach wetransfer.com directly — likely a corporate firewall or HTTP proxy. Configure Splunk's outbound proxy in the input settings or system-wide, and verify connectivity with a curl from the Splunk host. |